
Pending home sales trailed off for the fourth consecutive month in September, according to the National Association of REALTORS®. All four major regions recorded month-over-month and year-over-year declines in transactions.
The Pending Home Sales Index (PHSI), a forward-looking indicator of home sales based on contract signings, slumped 10.2% to 79.5 in September. Year-over-year, pending transactions slid by 31.0%. An index of 100 is equal to the level of contract activity in 2001.
"Persistent inflation has proven quite harmful to the housing market," said NAR Chief Economist Lawrence Yun. "The Federal Reserve has had to drastically raise interest rates to quell inflation, which has resulted in far fewer buyers and even fewer sellers."
Yun noted that new home listings are down compared to one year ago since many homeowners are unwilling to give up the rock-bottom, 3% mortgage rates that they locked in prior to this year.
"The new normal for mortgage rates could be around 7 percent for a while," Yun added. "On a $300,000 loan, that translates to a typical monthly mortgage payment of nearly $2,000, compared to $1,265 just one year ago – a difference of more than $700 per month. Only when inflation is tamed will mortgage rates retreat and boost home purchasing power for buyers."
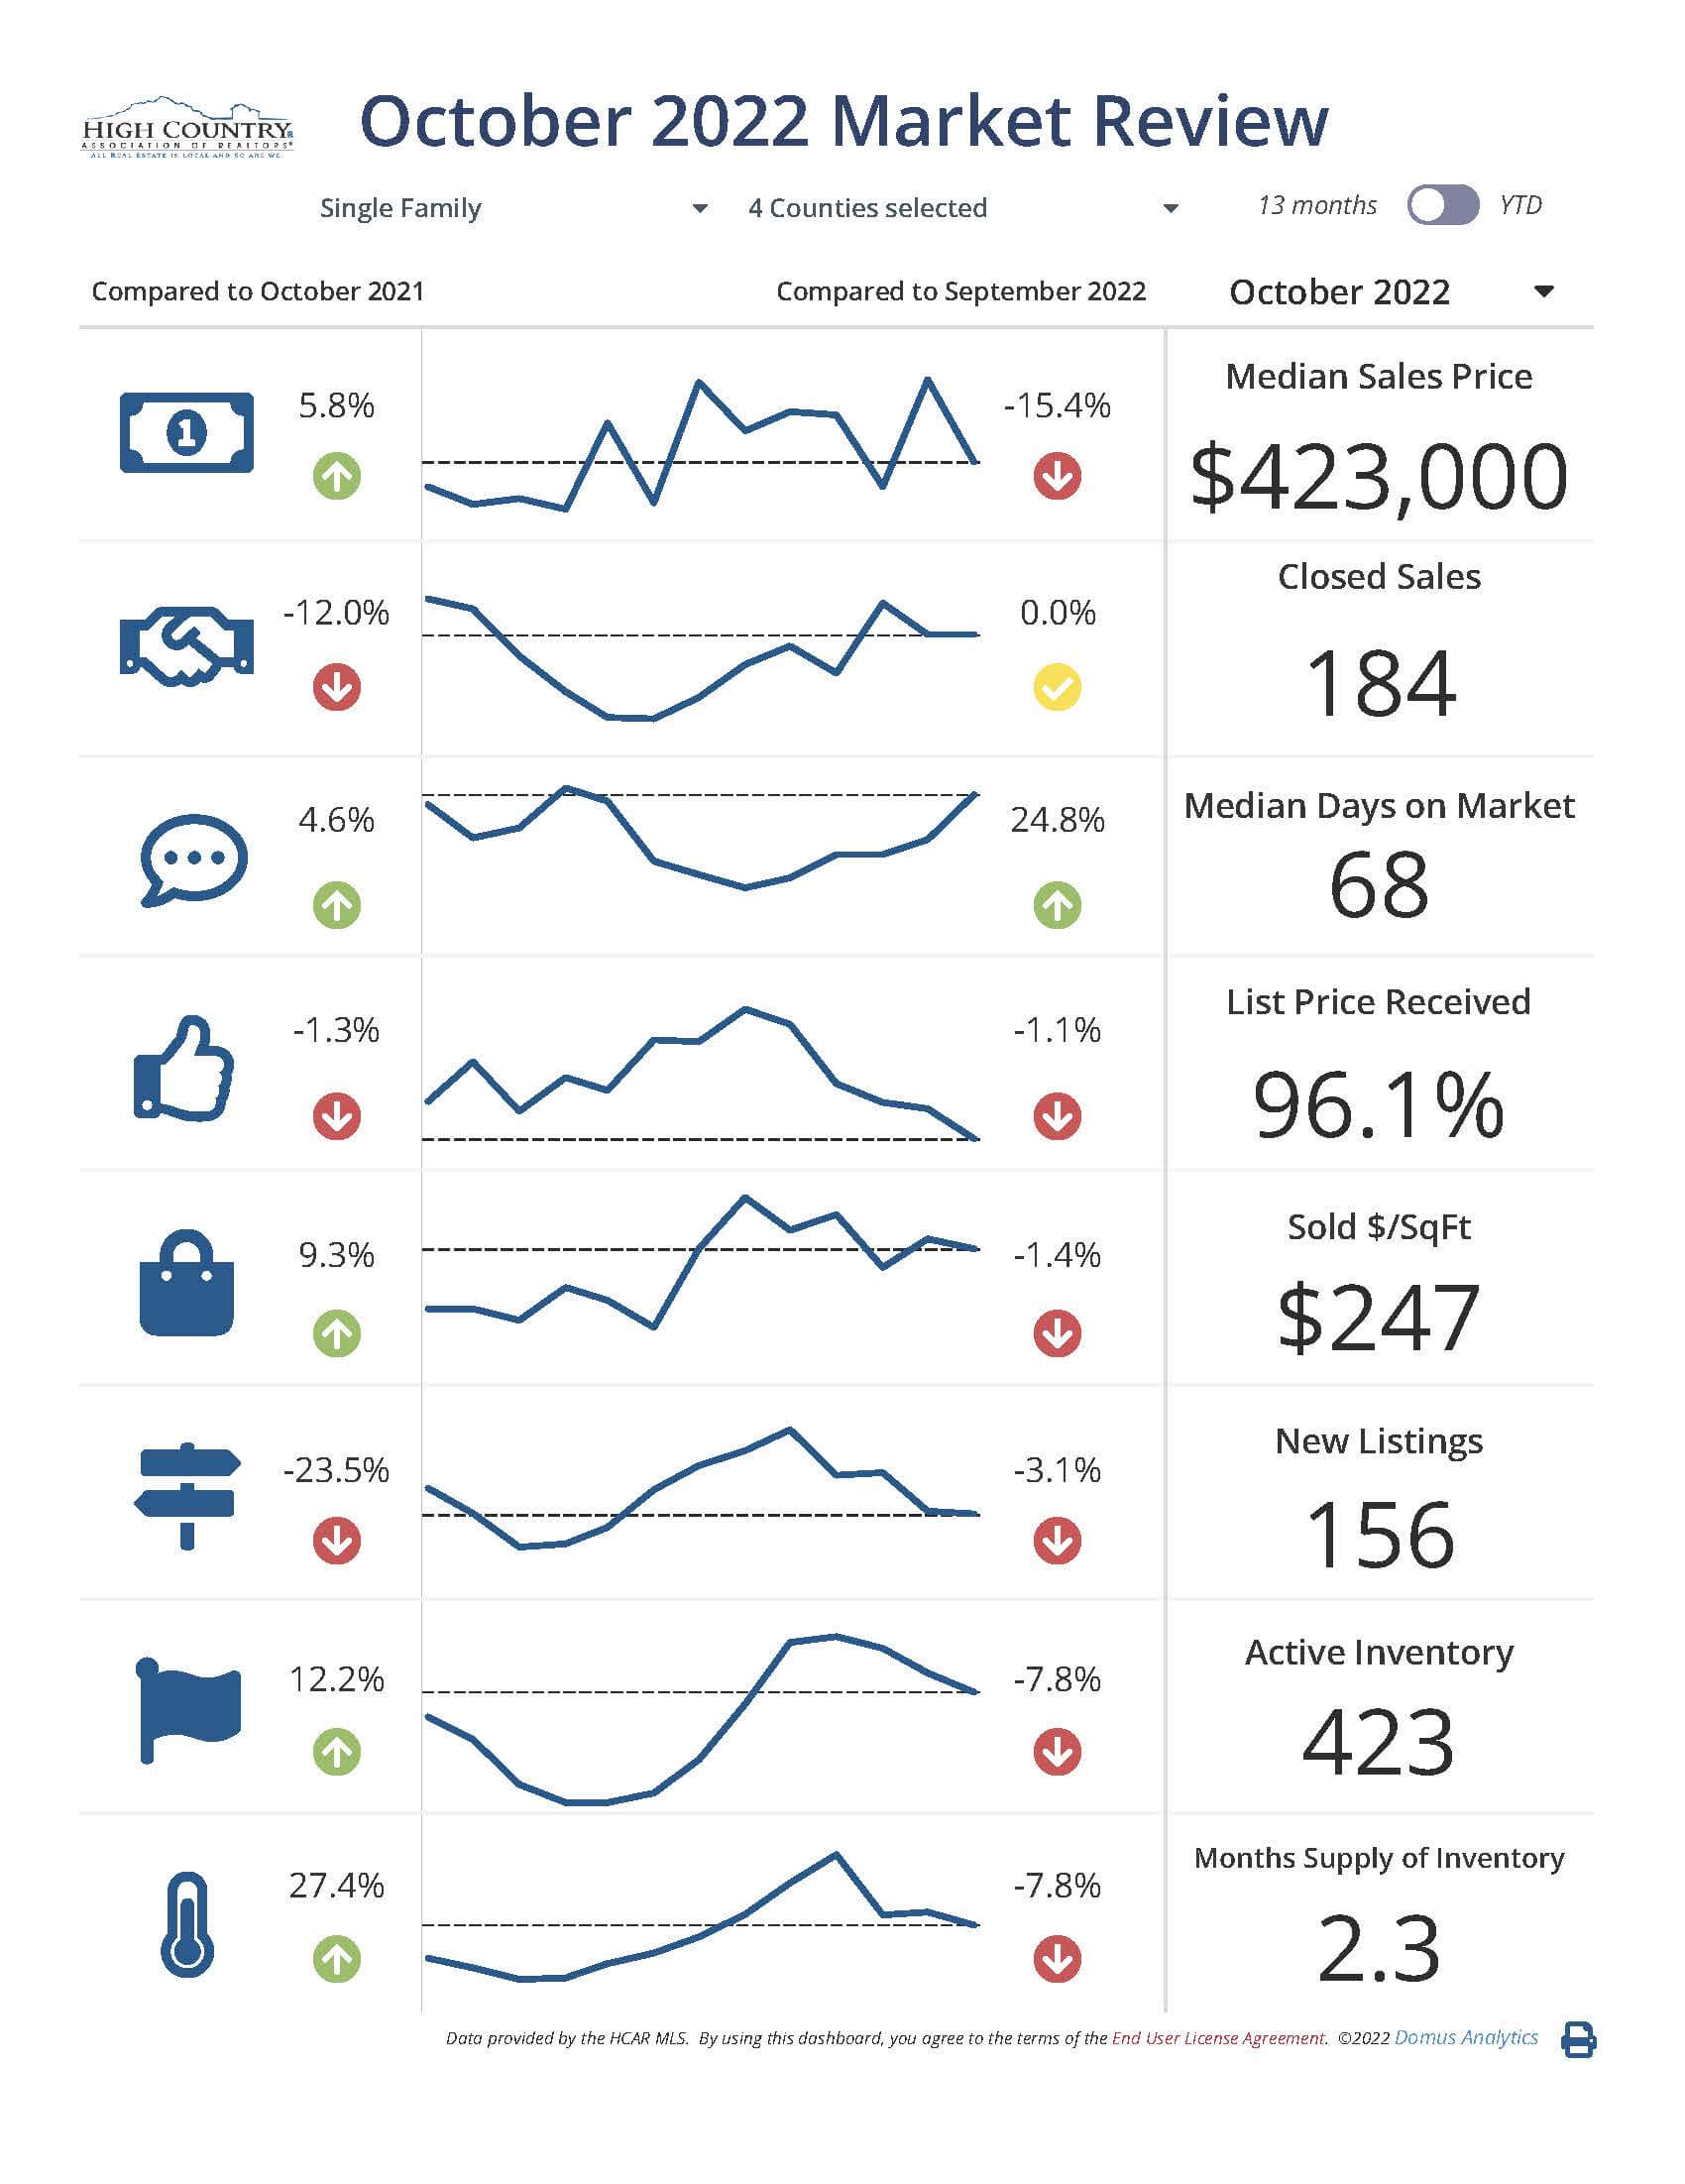
During October, High Country REALTORS® saw similarities to October of 2021. The High Country market appears to be holding steady. For single family properties the median sales price for October was $421,000 with $400,000 being the median this time last year. Median days on market are 68 days also consistent with the 65 median days on market this time last year. There were 183 single-family home sales in our four counties of Alleghany, Ashe, Avery, and Watauga during the month of October. Those sales were a combined total of $102.3 million. There were 209 single family sales this same time last year. Condos and Townhomes sold during October brought in an additional 43 sales to the High Country area totaling $19 million.
“Our market activity has tapered off in response to the interest rate hikes,” said Jim Lewis, president of the High Country Association of REALTORS®. “We continue to have high demand for homes in the High Country and diminished inventories and both those local factors have helped prices remain stable.”
Inventory: During the month of October, 419 single family homes were active in the High Country. New listings are down slightly with 156 new listings coming on the market in October. In 2021, 204 came onto the market in the same month. During October, Condos and Townhomes coming onto the market totaled 59 in New Listings. Condo and Townhome new listings are consistent with what we saw coming onto the market this same time last year. We currently have 2.3 months’ supply of Inventory of single-family listings in the High Country.
Alleghany County: REALTORS® sold 14 single family properties with a median sales price of $311,000 totaling a combined price of $4.5 million.
Ashe County: REALTORS® sold 52 single family properties with a median sales price of $327,450 totaling a combined price of $18.5 million.
Avery County: REALTORS® sold 33 single family properties with a median sales price of $351,000 totaling a combined price of $21.7 million.
Watauga County: REALTORS® sold 84 single family properties with a median sales price of $566,563 with a combined price of $57.6 million.
Land Sales: REALTORS® recorded 112 land sales in Alleghany, Ashe, Avery, and Watauga County for October totaling a combined price of $11.5 million. The median price for land in October was $45,000 with a 15.7 month supply of inventory and 1,742 land listings active during the month of October. Land inventory is strong.
Commercial Sales: High Country REALTORS® recorded three Commercial Sales during the month of October totaling just shy of $1 million. Two of the sales were in Ashe County, and one in Watauga.
Disclaimer: Figures are based on information from High Country Multiple Listing Service. Data is for informational purposes only and may not be completely accurate due to MLS reporting processes. This data reflects a specific point in time and cannot be used in perpetuity due to the fluctuating nature of markets.
Report graphics generated from Domus Analytics pulled from the HCAR RETS feed. HCAR Realtor® members can access these detailed and customizable reports and graphics for professional use by logging into the HCAR dashboard - Info Hub and clicking on the Resources tab, then the HCAR stats link. A public graphic is available on our website homepage at highcountryrealtors.org.
